Operating the platform
Monitoring and alerts
Scheduled re-scans, and a message when something about the perimeter changes.
Turning it on
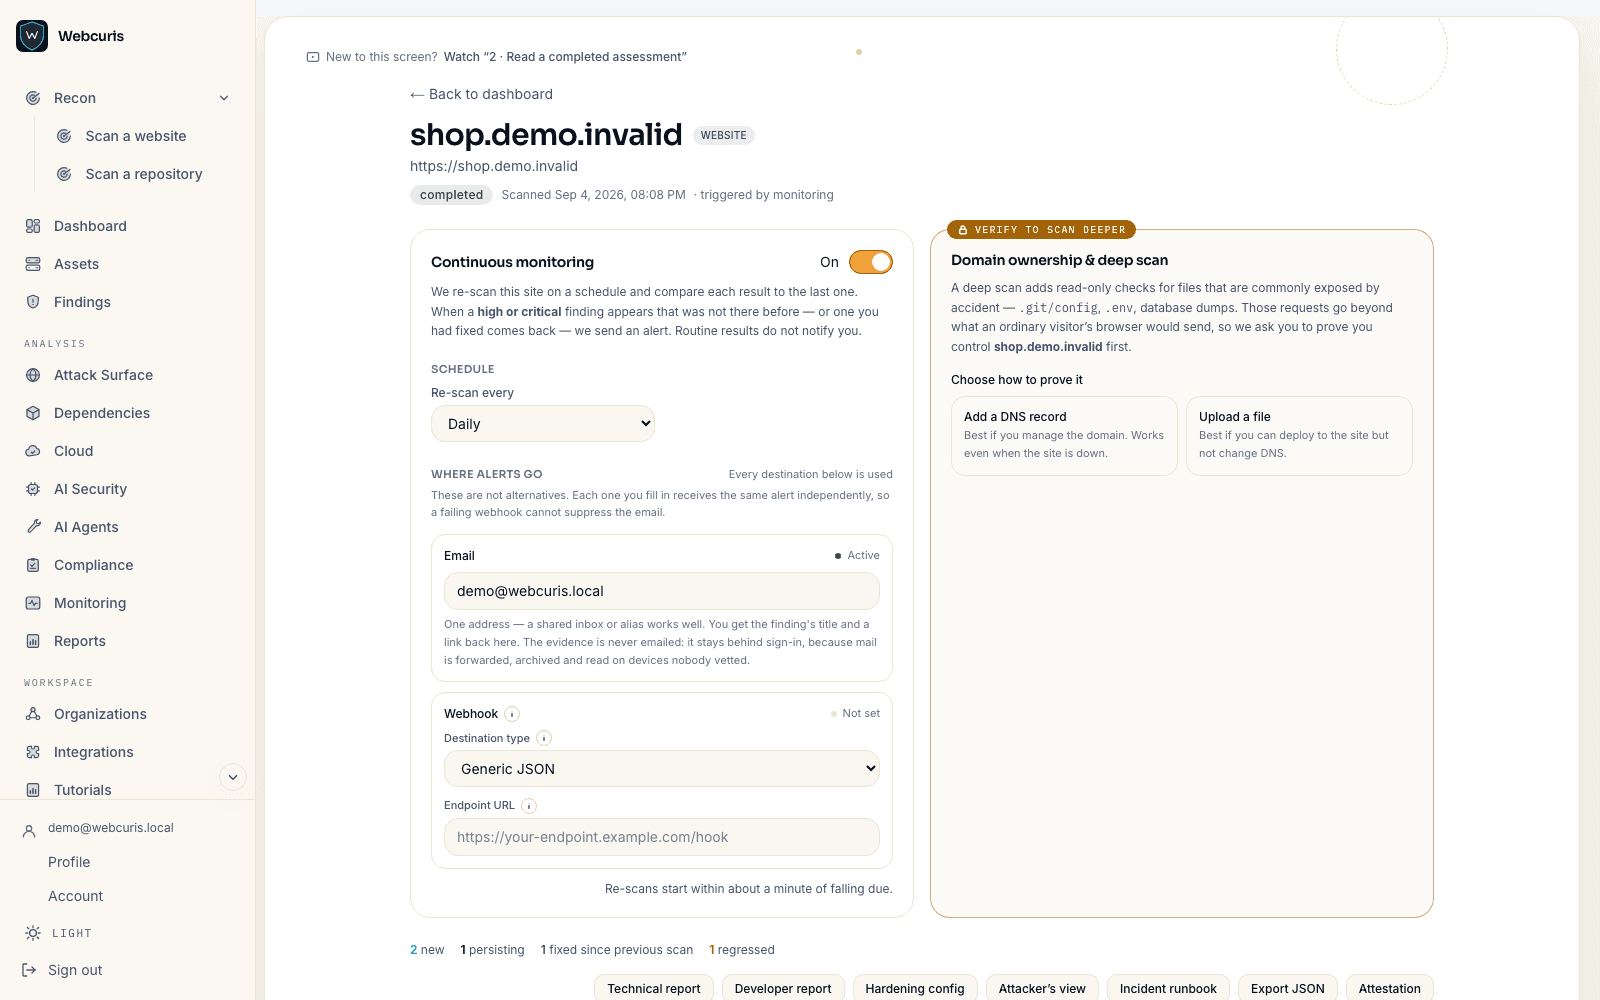
Monitoring is per asset and requires a verified domain. Enable it, choose a cadence, and choose where alerts go — your account address by default, and a webhook if you want them somewhere else.
What raises an alert
Perimeter changes are graded rather than all treated alike, because an alert for everything is an alert for nothing.
- High — nameservers changed, MX records changed, or a form's target host changed.
- Medium — the certificate issuer changed, or a new third-party script origin appeared.
- Low — a new subdomain appeared.
- Context only, never an alert — address changes and page-content changes. They are recorded so a real alert can be read against them.
What this does not do
Open ports are not monitored. Nothing in the platform performs port discovery, so a newly opened port will not raise an alert.
Testing the webhook
The webhook can be sent a test delivery from the panel, so you find out it is misconfigured now rather than during the incident it was meant to warn you about.