Your monitoring is watching the wrong end of the request
Our uptime monitor was green while every visitor saw an unstyled page. It was the second time every server-side signal agreed the site was fine while the browser disagreed — and the two incidents share a shape worth naming.
Webcuris Research
Security Engineering
·5 min read
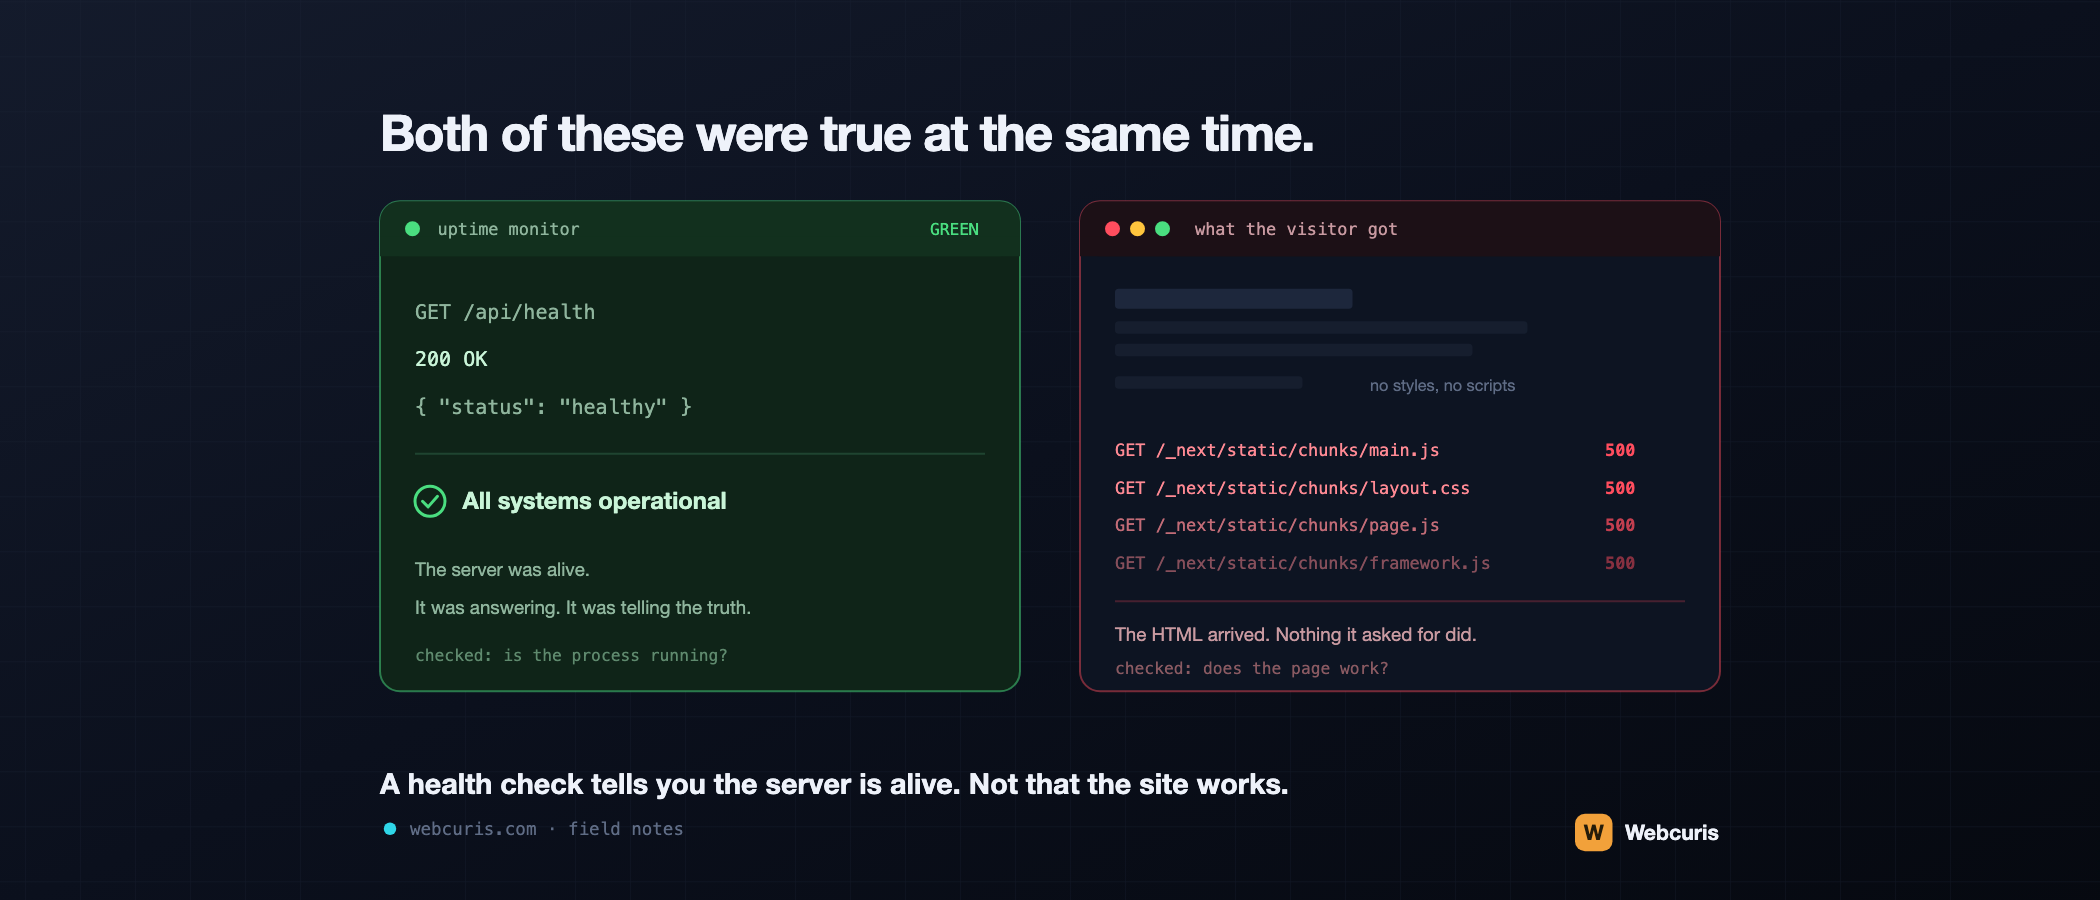
Our uptime monitor was green. The health endpoint returned 200 and the JSON said "status": "healthy". It was telling the truth.
Every visitor to the site was looking at a page with no styles and no JavaScript.
Both of those were true at the same time, for several minutes, and nothing we had running was capable of noticing the contradiction. This is the second time we have been caught by this exact shape of failure, which is why it is worth writing down rather than quietly fixing.
What actually happened
We build in place on the production host. A deploy fetches, installs, and runs the build, which clears the previous output directory before writing the new one. The server keeps running throughout — it is restarted at the end, once there is something new to serve.
That ordering is fine until the build does not finish. On this deploy the kernel killed it for memory: a build peaking near 2.9 GB on a 3.9 GB box that was also running production and staging, with half a gigabyte of swap. Unremarkable in itself.
What mattered was when it was killed — after the output directory had been emptied, and before the new build had been written.
deploy starts
  ↓
build clears .next/            ← the live assets are now gone
  ↓
build compiles…                ← killed here, out of memory
  ↓
(never reached) writes new .next/
(never reached) restart
The running server did not stop. It had no reason to. It kept answering requests with HTML it already held in memory — valid, complete, 200 OK. Every stylesheet and script that HTML referenced was a file that had just ceased to exist. Those returned 500.
Why every signal stayed green
- The health endpoint asked whether the process was running. It was.
- The HTML responses were genuinely 200. Nothing about them was wrong.
- No exception was thrown, so nothing was logged as an error — the server was not failing at anything it had been asked to do.
- The uptime monitor requested one URL and received a 200.
Every one of those was accurate. Not one of them was useful. The whole apparatus was answering a question nobody needed answered — is the process alive? — and nothing we had was arranged to ask the question that mattered: does the page work?
We had seen this before
A month earlier, a user told us a form was "not working at all". The error tracker was clean. The server logs were clean. The audit table that records every password-reset request had zero rows — not a few, zero, ever.
The cause was completely unrelated to memory. Our Content-Security-Policy carries a per-request nonce, and Next.js only injects that nonce into script tags on pages rendered per request. One page had quietly become statically prerendered, so it shipped script tags with no nonce, and the browser refused to execute every one of them. React never hydrated. The submit handler never attached. The button fell back to a native form submit that reloaded the page.
Different cause, same shape: a healthy server, 200 responses, clean logs, and a page that did not work in a browser. The zero rows in the audit table were not evidence of no traffic. They were evidence that no request had ever left the browser — an absence that looks exactly like quiet.
Once is an incident. Twice is a category.
A page load has two ends
It helps to stop thinking of a page load as a request. It is one request that returns a document describing several more.
The document is the near end. The stylesheets, scripts, fonts and images it asks for are the far end — and so is everything that happens after they arrive: whether the JavaScript parses, whether it is permitted to execute, whether the handlers attach.
Almost all conventional monitoring watches the near end. Health endpoints, uptime pings, status codes, response times, error rates: every one of them is measured at or before the document. Both of our outages lived entirely at the far end, which is why every near-end signal stayed green through both.
And the far end is where users live. Nobody experiences your HTML. They experience the page it becomes.
What to check instead
None of this requires new tooling. It requires asking a different question, four ways:
- Fetch a real asset, not just the document. Pull a script and a stylesheet URL out of your own HTML and request them directly. This is the single check that would have caught our outage in seconds.
- Render the page, don't just retrieve it. A headless browser that loads the page and reports console errors catches the whole class — blocked scripts, failed hydration, missing assets — in one step.
- Read the console on production, in a real browser, after a deploy. Our CSP failure could not exist in development, because development renders everything dynamically. It existed only in the production build, and only in a browser.
- Do it after every deploy, against production. Not staging, not a build artefact. The thing the public is currently being served.
The first one is ten seconds of shell:
# pull a real asset out of your own homepage and request it
ASSET=$(curl -s https://example.com/ | grep -o '/_next/static/[^"]*\.js' | head -1)
curl -s -o /dev/null -w '%{http_code}\n' "https://example.com$ASSET"
# 200 → the page can actually run. 500 → your health check is lying to you politely.
What we changed
The direct fix was unglamorous. The deploy script now refuses to begin a build the machine cannot fit, before anything is touched:
NEEDED_MB=2600
AVAILABLE_MB=$(( $(awk '/MemAvailable/ {print $2}' /proc/meminfo) / 1024 \
               + $(awk '/SwapFree/     {print $2}' /proc/meminfo) / 1024 ))
if [ "$AVAILABLE_MB" -lt "$NEEDED_MB" ]; then
  echo "Not enough memory to build safely." >&2
  exit 3
fi
export NODE_OPTIONS="${NODE_OPTIONS:---max-old-space-size=2560}"
Plus swap on the host, and a cap on the build's heap so it pages rather than growing without bound. That prevents this particular outage from recurring.
It does nothing about the next one, which will have a different cause and the same shape. The change that generalises is the check: after a deploy, fetch an asset the page actually needs, and look at what a browser would receive.
The short version
A health check that asks whether the process is running will never tell you whether the page works. They are different questions, and only one of them is the question your users are asking.
If every signal you own is measured before the browser gets involved, then every signal you own can be green while your site is broken. Ours were. Twice.
We build [Webcuris](/), which reads what a site actually serves rather than whether its server answers — and re-checks after every fix. Both incidents above happened to us, which is a reasonable part of why we think the second half of that sentence matters.
Keep reading
Vulnerability Scanning vs Security Monitoring: You Probably Need the One You Don't Have
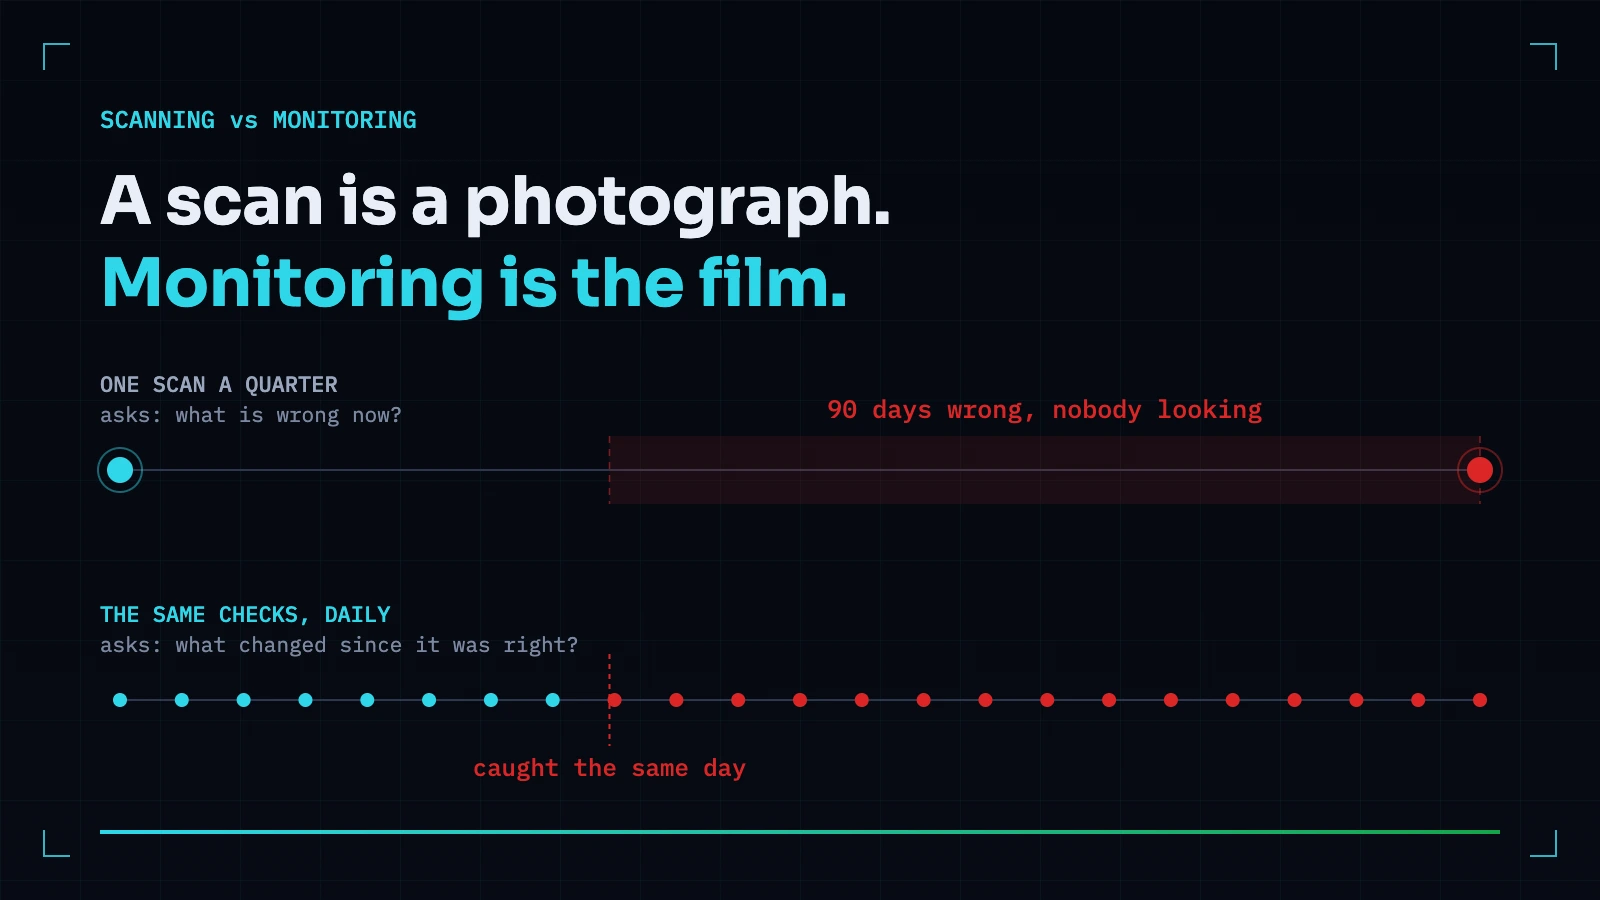
A scan answers what is wrong now. Monitoring answers what changed since it was right. Most teams buy the first and need the second — because the expensive incidents are almost always something that used to be correct.
Passive vs Active Security Scanning: What a Scanner Should Refuse to Do to Your Site
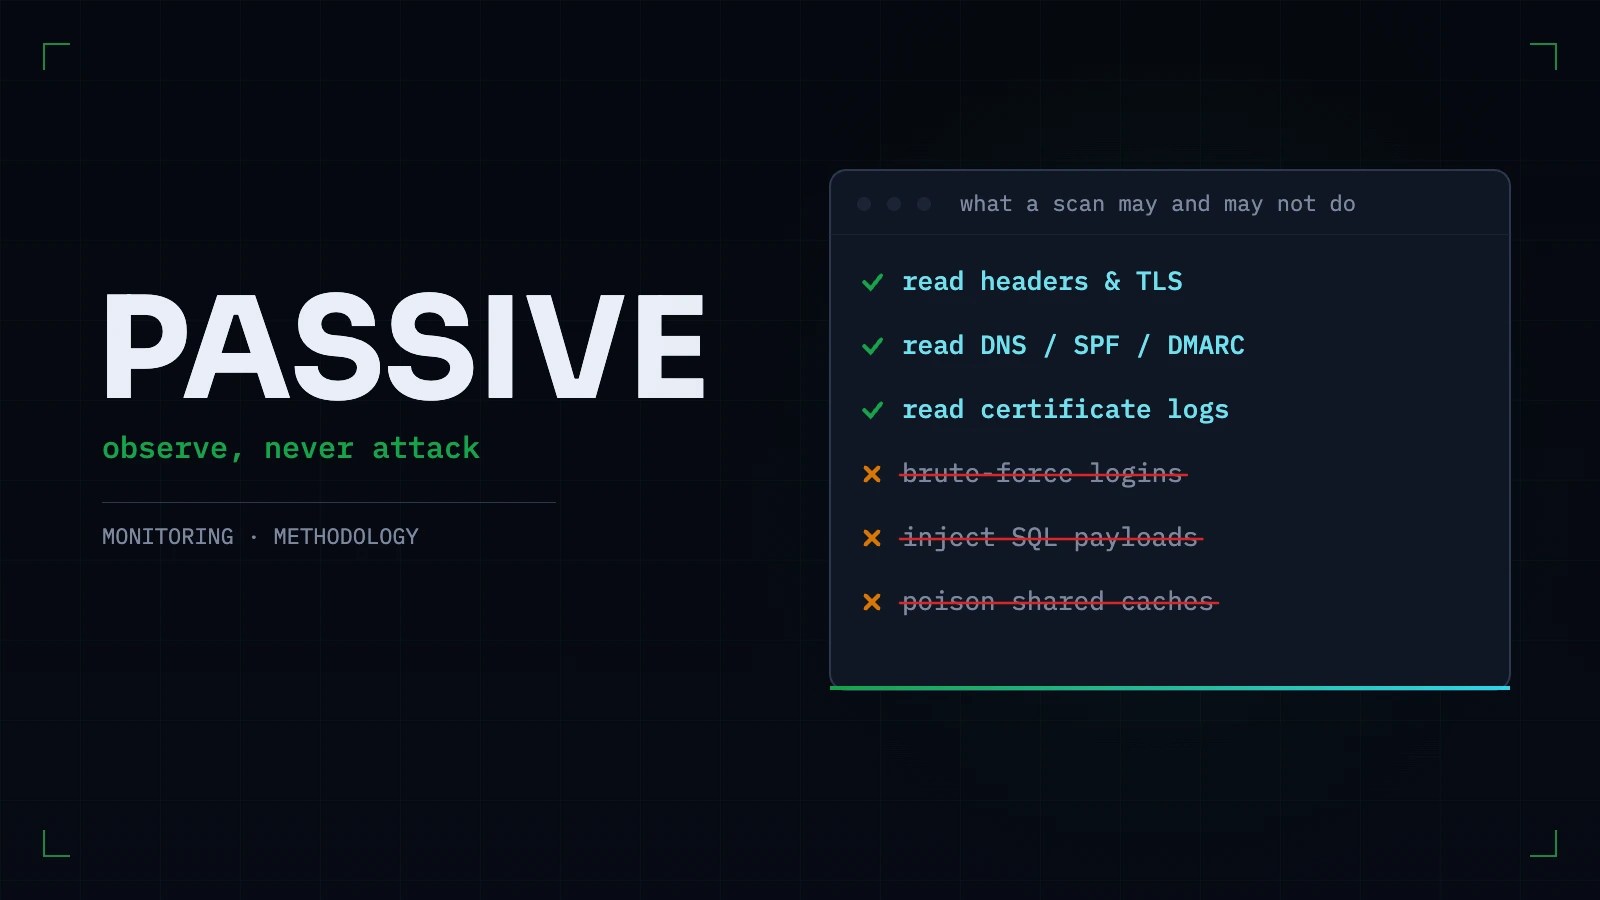
The line between observing a site and attacking one is sharper than vendors make it sound. What passive scanning can honestly find, what genuinely needs active testing, and the tests we refuse to run — with reasons.
What Is Continuous Website Security Monitoring? (And When a One-Time Scan Is Enough)
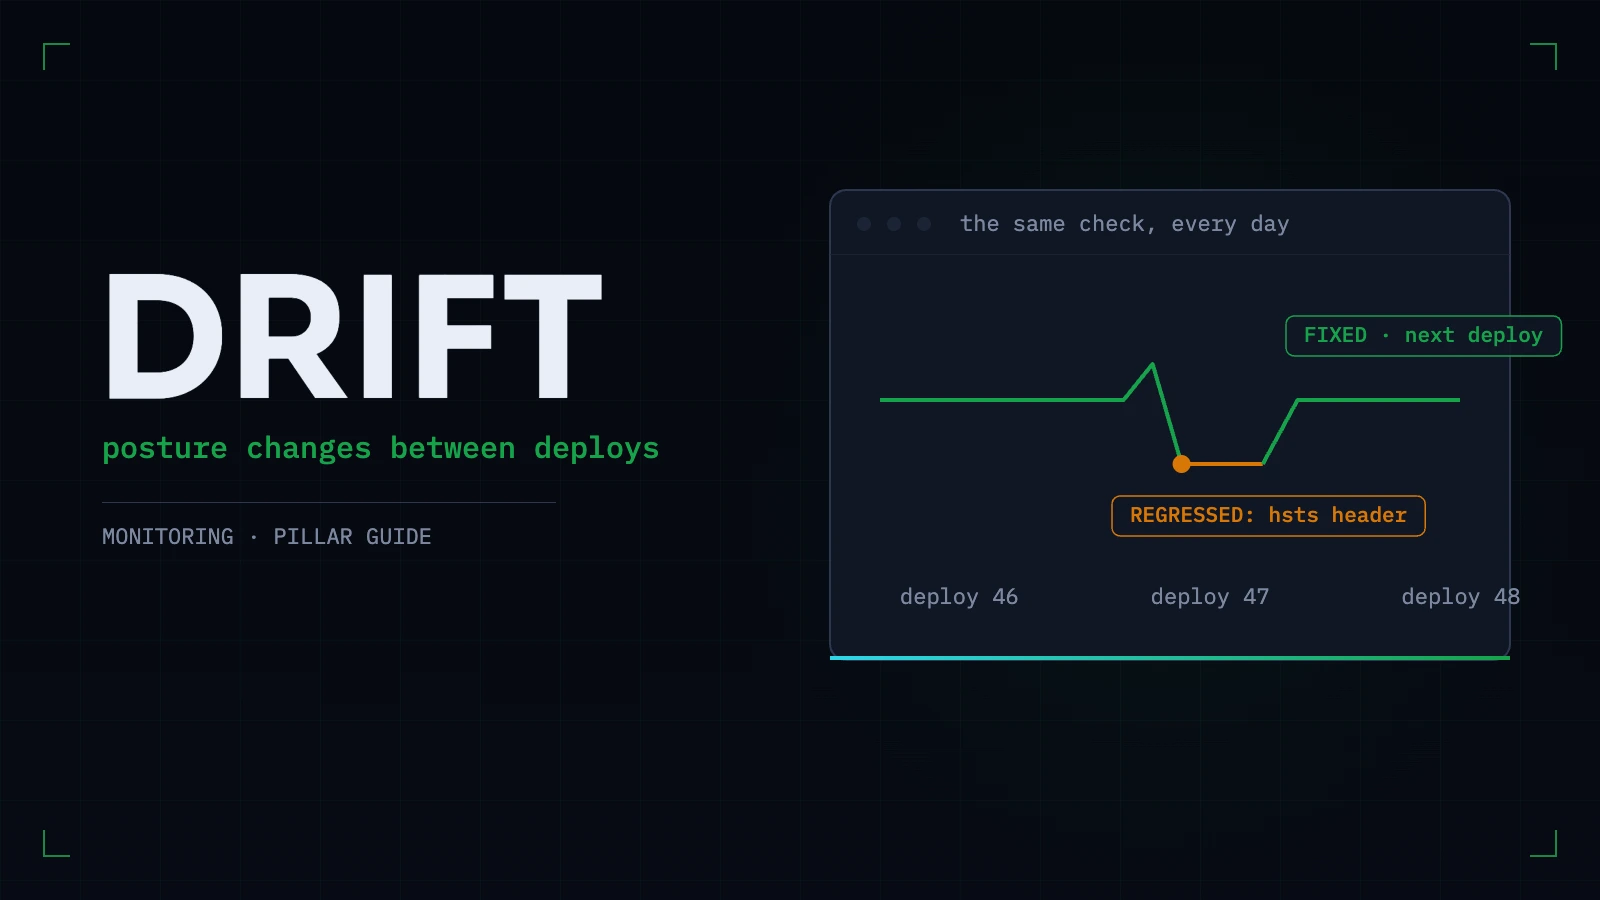
Two very different things are sold under one name. What posture monitoring actually watches, what a regression looks like, which checks belong on a schedule — and the honest cases where a single scan is all you need.
Everything this article describes is what Webcuris checks continuously — scan one page free, no signup.